How to reduce workload driven disk utilization in ONTAP 9
Applies to
ONTAP 9
Issue
- Disk IO latency is appearing due to too many operations at the same time due to user workload.
- Multiple volumes from a particular SVM/aggregate report high latency.
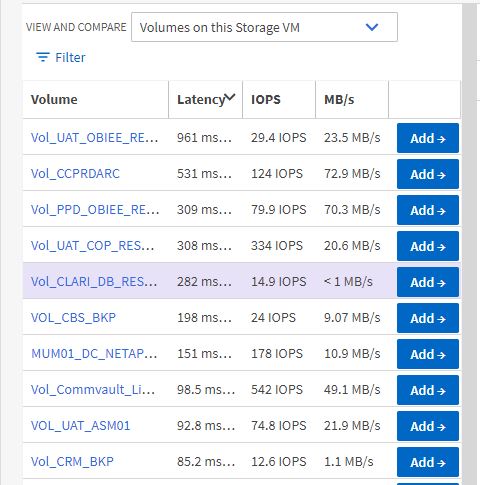
- Using Active IQ Unified Manager or
qos statistics volume latency show, latency is shown to be in the Disk or Aggregate Processing (Active IQ Unified Manager), and latency is actively impacted on the target volume.
Example:
cluster1::> qos statistics volume latency show -vserver svm1 -volume vol1
Workload            ID    Latency    Network    Cluster       Data     Disk    QoS Max    QoS Min      NVRAM
--------------- ------ ---------- ---------- ---------- ---------- ---------- ---------- ---------- ----------
-total-              -     4.71ms   185.00us     7.00us   468.00us     4.04ms        0ms        0ms    11.00us
vol1             32140    22.22ms    86.00us   125.00us   904.00us    21.11ms        0ms        0ms     1.00us
-total-              -     4.58ms   253.00us     7.00us   991.00us     3.32ms        0ms        0ms    11.00us
vol1             32140    29.69ms    90.00us   162.00us     2.61ms    26.82ms        0ms        0ms     1.00us
-total-              -     2.55ms   229.00us     8.00us   589.00us     1.71ms        0ms        0ms    13.00us
vol1             32140    18.84ms    61.00us   314.00us   136.00us    18.32ms        0ms        0ms     1.00us
-total-              -     4.33ms   198.00us     9.00us  1221.00us     2.88ms        0ms        0ms    13.00us
vol1             32140   177.16ms   113.00us   226.00us   108.03ms    68.79ms        0ms        0ms     2.00us
- The qos command
qos statistics workload resource diskshow listUser-Defaultas the top DISK workload.
Example:
cluster1::> qos statistics workload resource disk show -node nodeB
Workload            ID  Disk Number of HDD Disks
--------------- ------ ----- -------------------
-total-              -   98%                  44
User-Default         -   83%                  44
_Efficiency_...      -   10%                  44
_WAFL                -    3%                  44
_RAID                -    2%                  44