Poor client performance but ONTAP latency is good - Resolution Guide
Applies to
ONTAP 9
- High-end user latency reported from Internal monitoring software or customer concerns.
- Low throughput/Poor Performance reported by end users
- Data ONTAP and NetApp monitoring tools show low latency when reviewed
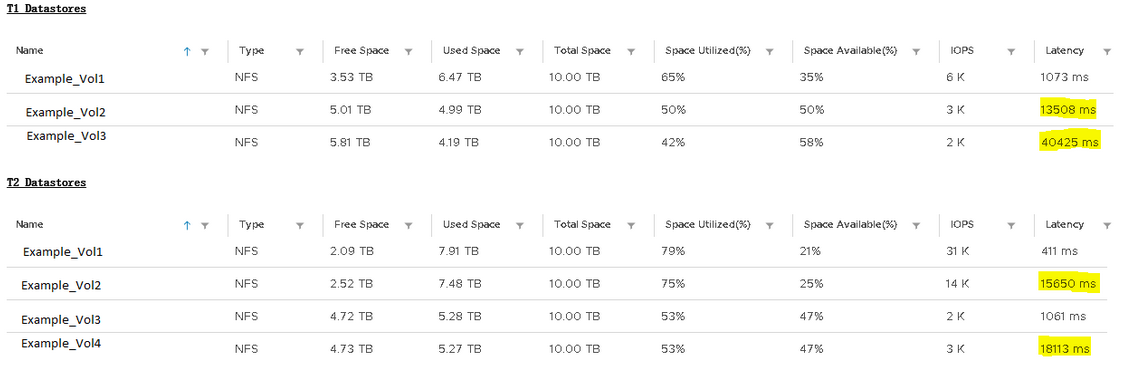
Example: vSphere reports high-volume latency or the ESX host reports latency in the log:
2020-09-17T01:31:14.178Z cpu44:2098185)WARNING: ScsiDeviceIO: 1564: Device naa.600a0920002002020202020202020202 performance has deteriorated. I/O latency increased from average value of 744 microseconds to 1515626 microseconds.
Example: qos statistics volume latency show command shows low latency:
Cluster::> qos statistics volume latency show -volume Example_Vol -vserver VS1
Workload            ID    Latency    Network    Cluster       Data       Disk    QoS Max    QoS Min      NVRAM      Cloud  FlexCache    SM Sync         VA
--------------- ------ ---------- ---------- ---------- ---------- ---------- ---------- ---------- ---------- ---------- ---------- ---------- ----------
-total-              -     2.21ms   101.00us    75.00us   400.00us     1.62ms       0ms        0ms     7.00us        0ms        0ms        0ms        0ms
Example_Vol..     3195  1295.00us   478.00us        0ms   777.00us    26.00us       0ms        0ms    14.00us        0ms        0ms        0ms        0ms
Note: In addition, check the qos statistics volume performance show command because of offbox latency.
For more information, see article: High latency seen on clients, but not in qos statistics volume latency show