NetApp Knowledge Base

How to troubleshoot and resolve FabricPool Performance issues or "measured latency from cloud" alerts

Views:
8,124
Visibility:
Public
Votes:
4
Category:
ontap-9
Specialty:
Perf
Last Updated:

Applies to

  • ONTAP 9.2+
  • FabricPool

Issue

  • Users may report slow performance when accessing data blocks that have been moved to the capacity tier when using FabricPool in ONTAP 9.
  • EMS messages may be logged such as this example:

Tue Sep 03 10:21:14 MDT [nodename1: TimerCallback: wafl.ca.latency.threshold:notice]: Measured latency from cloud (10024 msec) more than threshold (1000 msec) (aggregate: "agggr01", aggregate uuid: "12345678-1234-1234-1234-1234567890ab", object store: "store1")

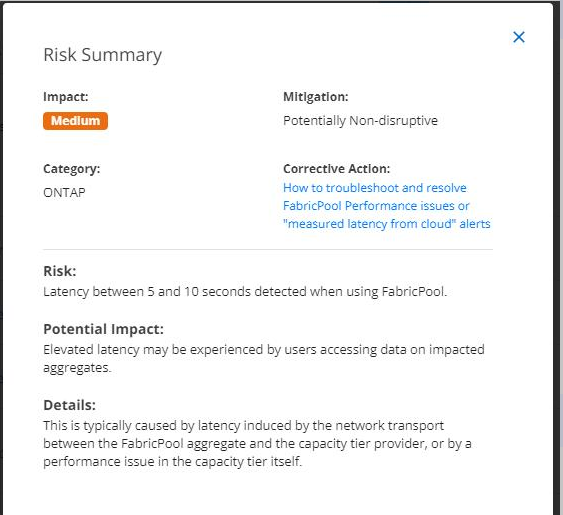
  • Latency between 5 and 10 seconds detected when using FabricPool alert such as below

AIQ ARS wafl.ca.latency.threshold.png


Sign in to view the entire content of this KB article.

New to NetApp?

Learn more about our award-winning Support

NetApp provides no representations or warranties regarding the accuracy or reliability or serviceability of any information or recommendations provided in this publication or with respect to any results that may be obtained by the use of the information or observance of any recommendations provided herein. The information in this document is distributed AS IS and the use of this information or the implementation of any recommendations or techniques herein is a customer's responsibility and depends on the customer's ability to evaluate and integrate them into the customer's operational environment. This document and the information contained herein may be used solely in connection with the NetApp products discussed in this document.