What can take up "other" in Space Utilization Graphs in Datastore Performance Charts
Applies to
- ONTAP
- VMware
Answer
- See VMware's official response in KB: Understanding Space Utilization Graphs in Datastore Performance Charts (2003090)
- All other non-managed files placed on the datastore, such as documentation, backups, and ISO or Floppy images. Includes all virtual machine files which are not associated with a registered virtual machine. On ESX, includes the Service Console's virtual disk file (esxconsole.vmdk).
- Overcommited aggregates also cause this. For example:
- Verify aggr0 space
::> run -node node-1 "df -Ah"
Aggregate total used avail capacity
aggr0 6245GB 4488GB 1756GB 72%
aggr0/.snapshot 0TB 0TB 0TB 0%
- Create a thin provisioned volume in the aggregate larger than the available space in the aggregate
::> vol create -name vol1 -aggregate aggr0 -size 20TB -space-guarantee none
[Job 9261] Job succeeded: Successful
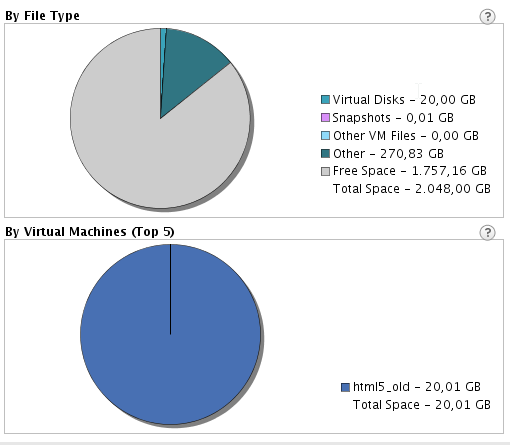
- Move a 20GB VM into the volume so we have the following:
Volume size = 2048GB
VM size = 20 GB
Avail size = 2028 GB
- Notice how VMware shows the "Free Space" as 1,757.16GB and "Other" as 270.83GB. Since the aggregate doesn't have the space requested for the thin provisioned volume, VMware counts the missing space as "other". This is expected behavior.
Additional Information
N/A